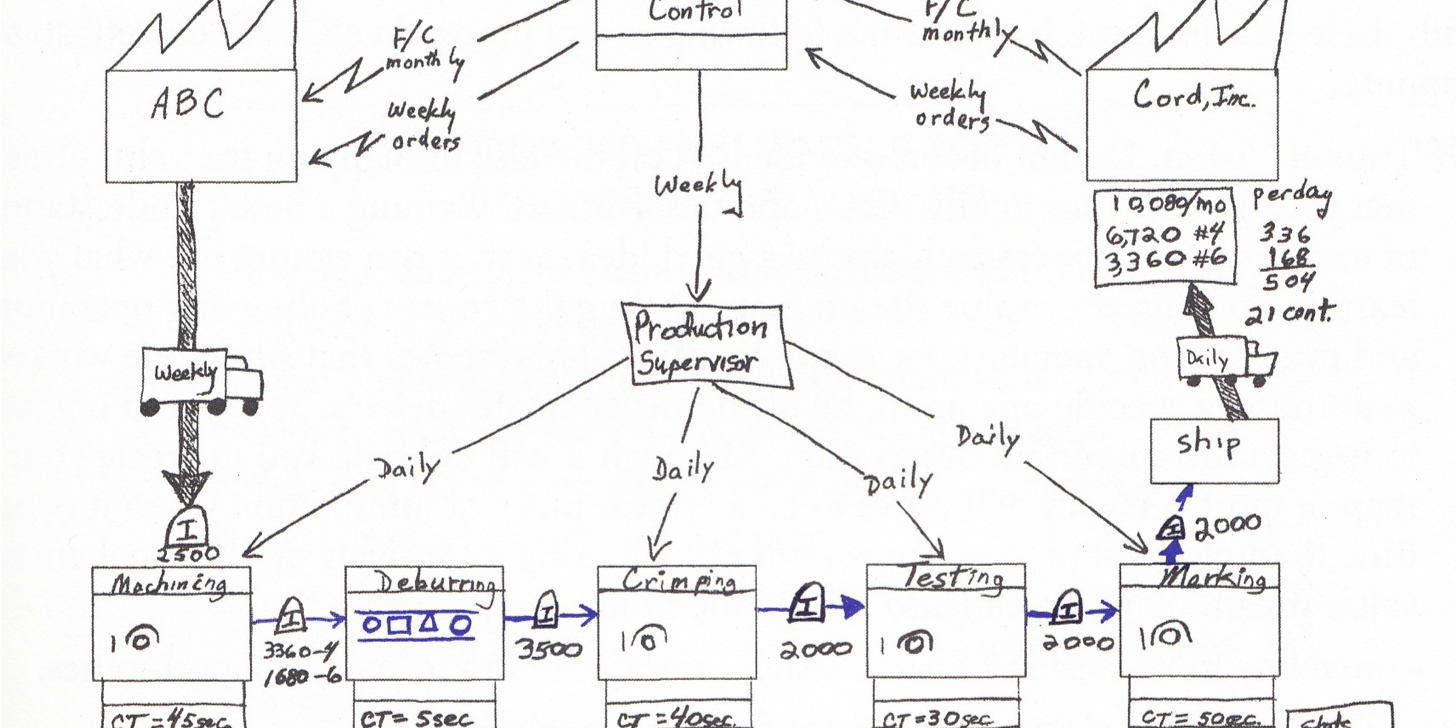
In his (awesome) book ‘Learning to See’, Mike Rother writes, “whenever there is a product for a customer, there is a value stream. The challenge lies in seeing it”.
We couldn’t agree more, and are enthusiastic advocates of the Value Stream Mapping (VSM) approach. But maybe something in the language of it, or in the interpretation of its application, leaves some people thinking, “that’s not for me”.
The word ‘product’ can be problematic. It brings to mind production processes and the manufacturing of ‘things’. But Value Stream Mapping applies equally to the delivery of a service or the fulfilment of a requirement. Any process, in fact.
The term ‘Value Stream’ might also be off-putting as it sounds a little technical, but its really talking about all the tasks (those that add value and those that don’t) which are involved in delivering the service, or the product, or the fulfilment of the requirement, to the customer. Value Stream Maps can also include additional information, such as information flows (manual or electronic), unit and cycle time, the number of staff/resources involved, work volumes and error rates. Information on work in progress, inventory or queue sizes is especially helpful in developing an understanding of how the process ‘flows’.
The power of the Value Stream Map lies in its ability to make all of this visible.
People often tell us that process improvement is easier when you can see the work that is being undertaken. Many times we have heard, “it would be easier if we were making widgets, but our work isn’t like that”. How valuable then, is the ability to make the work visible through Value Stream Mapping!
After all, we are wired up in a way that makes visual communication easier and quicker to assimilate than other forms. It is believed that non verbal, visual information is processed 60,000 times faster than text. It’s also true that we are bombarded with so much information on a daily basis – 100,500 words per day, or 23 per second! – that if we converted all that into gigabytes, and our brains were laptop computers, they’d be overloaded within a few days. Many suspect that as a result of having to cope with so much, our attention spans are shrinking and we’re losing a depth of thought as a consequence.
How refreshing then to make the work we do visual, using nothing more complex than a pencil, some paper and maybe some post-its, so that we can understand more about our processes.
If you are interested in Value Stream Mapping, why not take a look into our very popular two-day Value Stream Mapping Master Class course with the charismatic Chris Merriman! You can find out more about our master classes by clicking here.


